Explaining the flare echo (hail spike) Hearing Doppler Effect ... Lee's lassoing demonstration Doppler Effect applet (sound) Doppler Effect interactive with a rowboat Doppler Effect Applet
Chapter 6: Surface Patterns of Pressure and Wind
Drawing isobars
Air pressure simulator (sort of)
Correcting to sea level
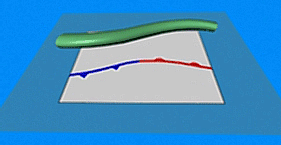
Forces acting on Air Parcels Interactive force diagram (PGF, Coriolis, Friction)
Troughs and ridges
Circulations around surface highs and lows
Lessons from a football field
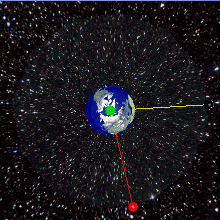
Coriolis effect; Coriolis on Merry-Go-Round
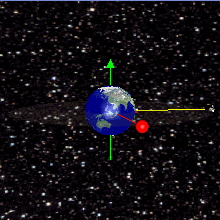
Earth's rotation, viewed from North Pole and South Pole Coriolis "Video Game"
Global animations of pressure
Chapter 7: Upper-Air Patterns of Pressure and Wind
Pressure decreases faster in cold air than in warm air Perspective on pressure surface Pressure surface slice Going from a constant pressure surface to drawing contours Ridge/trough evolution Balance of forces aloft produces geostrophic wind
Existence of the mid-latitude jet stream
SVS jet stream simulation
Typical jet stream in Winter, Summer
Ridge/trough air flow Temperature gradient / jet stream simulator
Movement of air through a jet streak
Computer simulation of eddies associated with CAT
Global animations of 500-mb height, wind, omega
Chapter 8: The Role of Stability in Weather
Interactive Sounding Tool Evolution of temperature sounding on clear summer day Effect of mid-level inversion on ascent Temperature changes in a rising or sinking parcel Bergeron-Findeisen Process Ice crystal structure Effect of surface heating on atmospheric overturning How an inversion breaks, allowing fog to dissipate
Satellite imagery, watching valley fog dissipating
Mountain lee wave clouds on visible satellite animation
Finding the LCL
Contrail formation applet
Potential temperature cross section
Exploring acceleration and velocity in buoyant parcels
Virtual temperature calculator
Wet-bulb temperature calculator
Equivalent potential temperature (theta-e) interactive Equivalent potential temperature (theta-e) dependence on T and Td
Lifting a parcel and tracking changes in T, Td, VP, etc
Relationship between CAPE and maximum vertical velocity
Chapter 9: Thunderstorms
Lightning at full and slow speed: Video 1, Video 2 Re-creation of Franklin Kite experiment
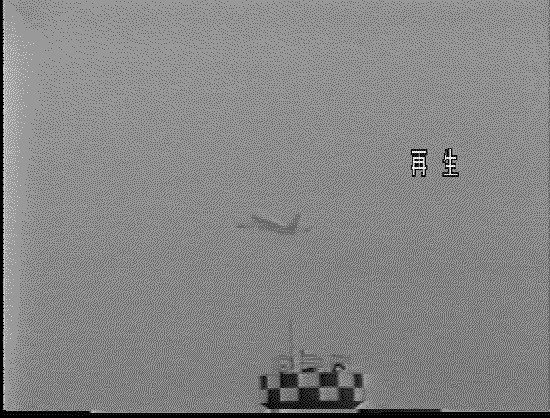
Lightning striking plane video; Plane 2
Global lightning climatology maps
Annual migration of lightning flashes
Radar loop of air-mass thunderstorms
Sea-breeze front explanation
Thunderstorms along the sea-breeze front Radar loop of land-breeze thunderstorms
Radar loop of thunderstorms developing due to a high-level heat source Elevated convection interative
Computer simulation of outflow boundary
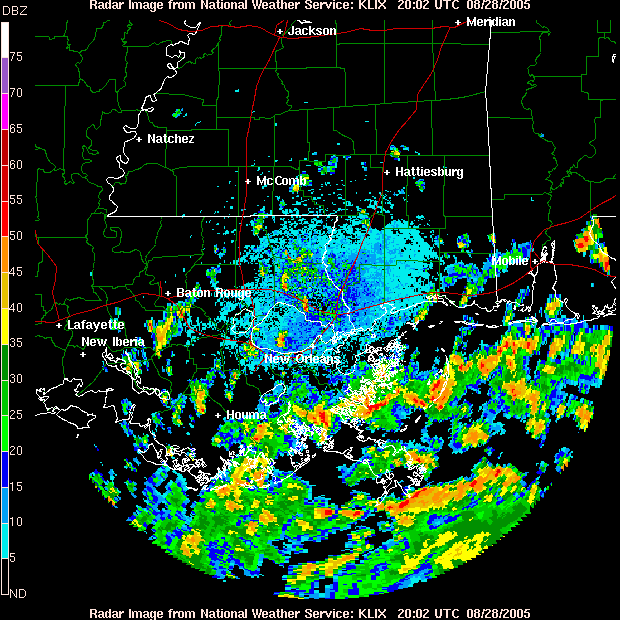
Radar imagery shows colliding outflow boundaries over Southeastern Pennsylvania, Colliding gust fronts produce new t'storms
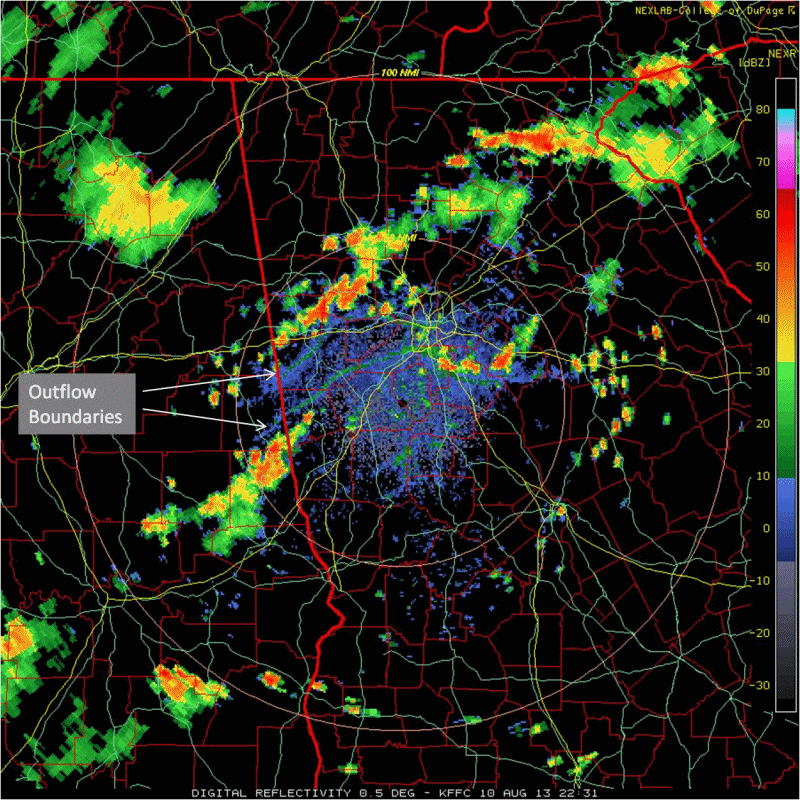
Almost perfectly symmetrical outflow boundary
Erosion of capping inversion as sun rises
Cap strength vs. CAPE
Radar detects sea-breeze front coming inland
Satellite imagery of Erie lake breeze initiating severe thunderstorms
Satellite imagery shows mesoscale boundaries everywhere
Model of a single-cell thunderstorm
Movement of multi-cell thunderstorms
Example of removing storm motion from Doppler velocity: Wind vectors, Speed colorized
Plane flying through microburst
Animation of a downburst, Microburst 6/14/11
Flash Flood Toowoomba, Australia - January 10, 2011
Chapter 10: Tropics, Part I: Patterns of Wind, Water and Weather
Average flow in tropics and mid-latitudes as demonstrated by water vapor imagery 